

Lean Manufacturing: Value Stream Mapping
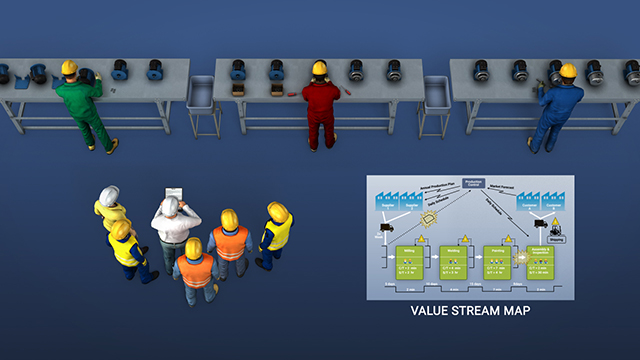
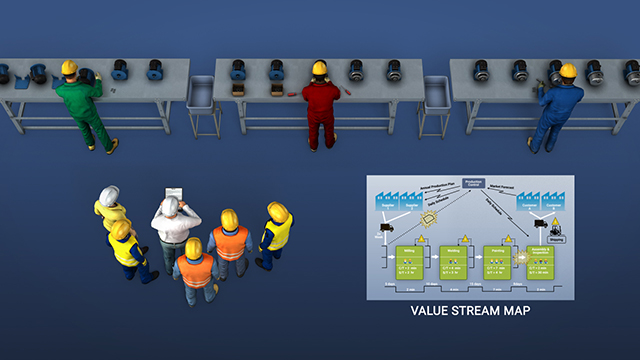
Have you ever heard of value stream mapping? Value stream mapping (VSM) is a Lean tool that allows you to create a visual representation, from order receipt through to the arrival of the product to the customer, without concentrating on the period of lead time taken up by manufacturing. In this interactive online course, we will review the concepts of value stream mapping, the steps in value stream mapping, and list the benefits of this useful tool.
Request a demoCourse Details
Learning Objectives
- Recall the concepts of Value Stream Mapping
- List the steps in Value Stream Mapping
- Identify common symbols used in a Value Stream map
- List the benefits of Value Stream Mapping
Specs
| Course Level | Intermediate |
| Languages | English |
| Compatibility | Audio, Video |
| Based on: | Industry Standards and Best Practices |
Key Questions
What is value stream mapping?
Value stream mapping (V-S-M) is a Lean tool that allows you to create a visual representation, from order receipt through to the arrival of the product to the customer, without concentrating on the period of lead time taken up by manufacturing.
What is takt time?
Takt time is the production pace or speed that every step of a process should take.
What is cycle time?
Cycle time is the actual time it takes to produce a unit, or the total time between the completed production of a full unit to the completed production of the next unit.
What is setup time?
Setup time is the amount of time needed to prepare for a process step.
What is lead time?
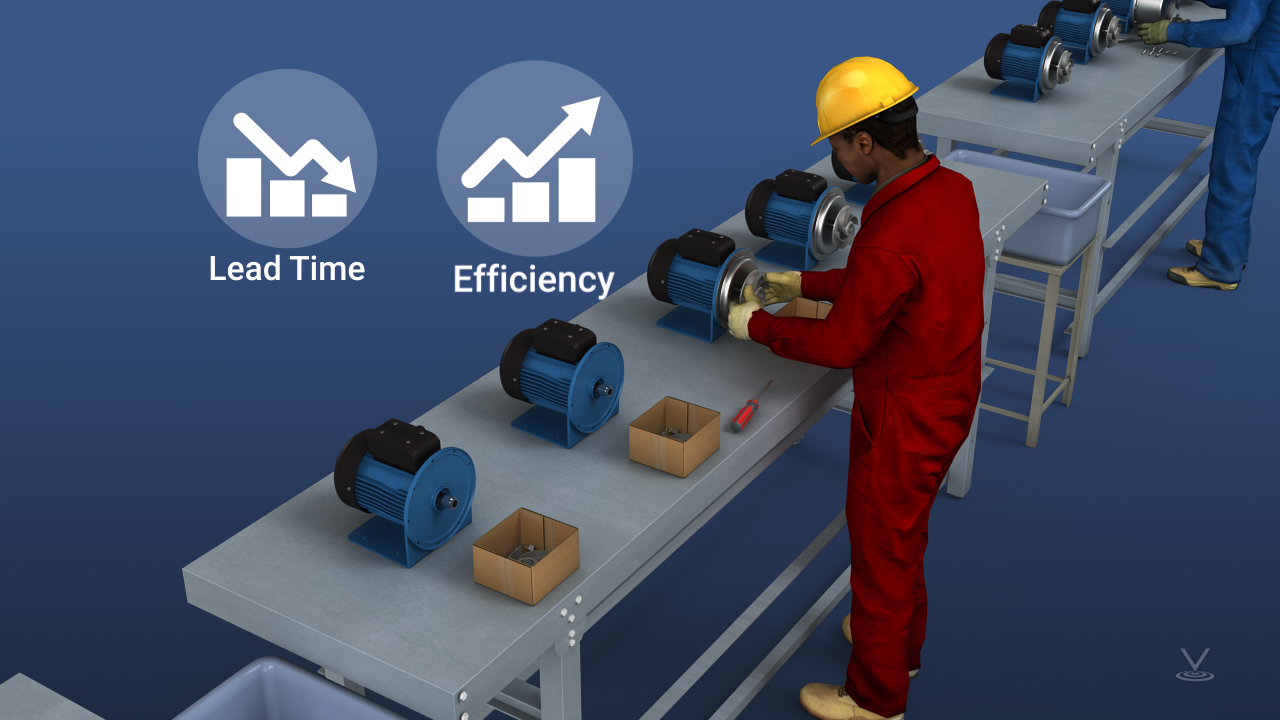
Lead time is the average time needed for an order to be processed through the whole processing cycle up to delivery to the customer.
Sample Video Transcript
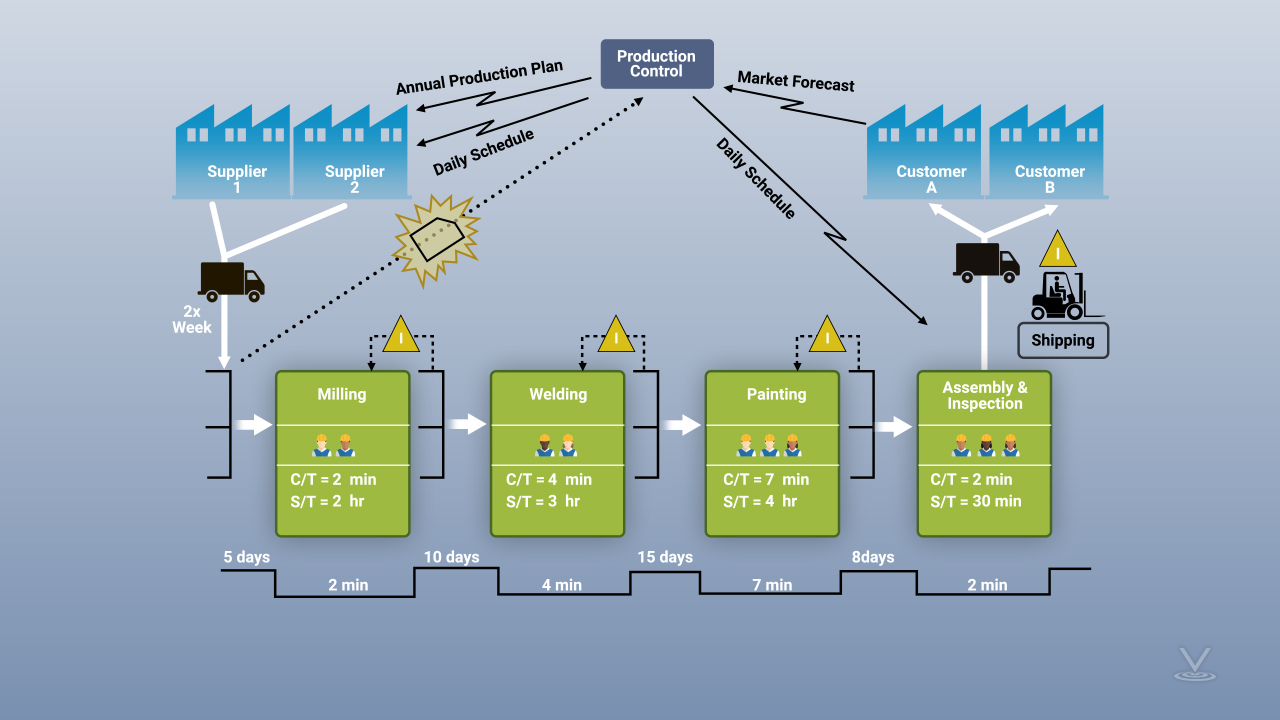
Symbols used on a value stream map (VSM) are precise visual representations of the steps of a process. There’s a group of symbols that are widely used when constructing a VSM. New ones could always be used (as long as its meaning is clearly defined), but it’s usually easier to use what is already available. Symbols help define a lot of information on the map without having to describe most of the standard operations. We’ll illustrate some examples of widely used symbols in this value stream map example. The triangle with an I in it represents an “on-queue” status either for inventory or quality checks. The trucks on either end of the map represent either receiving material from a supplier or shipping material out to a customer. Across the map you’ll see where all the process information goes with the data boxes below:
• The forklift symbol represents transporting inventory.
• There are symbols for both suppliers and customers.
• The little people represent operator involvement.
• The starburst (Kaizen burst) represents a burst event that has been selected to be improved.
• The trapezoid within the starburst represents Kanban information to replenish supplies.
• Arrows represent material flow.
Course Applies To
Demos + Pricing
Learn more about our courses, get pricing, and see our platform.


